css3转换
本文共 1976 字,大约阅读时间需要 6 分钟。
1 2D转换

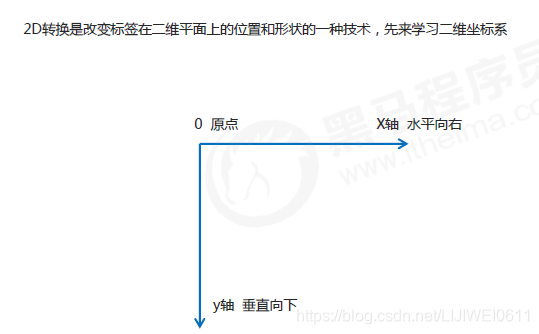
1.1 二维坐标系

1.2 2D转换之移动translate


Document
实现盒子中的盒子水平居中,垂直居中
Document 123
1.2 2D旋转之rotate

鼠标经过,图片旋转360度
Document
三角形
Document
旋转中心点transform-origin

Document
图片从左下角逆时针旋转出现
Document
1.3 2D转换之缩放scale

Document 123123
鼠标经过,图片变大
Document

Document
- 1
- 2
- 3
- 4
- 5
- 6
- 7
1.4 2D转换综合写法

Document
2 css3动画
2.1 什么是动画
-
动画是
CSS3中最具颠覆性的特征之一,可通过设置多个节点来精确的控制一个或者一组动画,从而实现复杂的动画效果
2.2 动画的基本使用
-
先定义动画
-
在调用定义好的动画
2.3 语法格式(定义动画)
@keyframes 动画名称 { 0% { width: 100px; } 100% { width: 200px }} 2.4 语法格式(使用动画)
div { /* 调用动画 */ animation-name: 动画名称; /* 持续时间 */ animation-duration: 持续时间;} 2.5 动画序列
-
0% 是动画的开始,100 % 是动画的完成,这样的规则就是动画序列
-
在 @keyframs 中规定某项 CSS 样式,就由创建当前样式逐渐改为新样式的动画效果
-
动画是使元素从一个样式逐渐变化为另一个样式的效果,可以改变任意多的样式任意多的次数
-
用百分比来规定变化发生的时间,或用
from和to,等同于 0% 和 100%
2.6 代码演示
Document
2.7 常见的属性

代码演示
Document
2.8 动画简写方式
-
动画简写方式
/* animation: 动画名称 持续时间 运动曲线 何时开始 播放次数 是否反方向 起始与结束状态 */animation: name duration timing-function delay iteration-count direction fill-mode
-
知识要点
-
简写属性里面不包含
animation-paly-state -
暂停动画
animation-paly-state: paused; 经常和鼠标经过等其他配合使用 -
要想动画走回来,而不是直接调回来:
animation-direction: alternate -
盒子动画结束后,停在结束位置:
animation-fill-mode: forwards
-
-
代码演示
animation: move 2s linear 1s infinite alternate forwards;
2.9 热点图案例
2.10 速度曲线细节
-
速度曲线细节

Document 世纪佳缘我在这里等你
奔跑的熊大
Document
转载地址:http://gsql.baihongyu.com/
你可能感兴趣的文章
Nginx 反向代理 MinIO 及 ruoyi-vue-pro 配置 MinIO 详解
查看>>
nginx 反向代理 转发请求时,有时好有时没反应,产生原因及解决
查看>>
Nginx 反向代理+负载均衡
查看>>
Nginx 反向代理解决跨域问题
查看>>
Nginx 反向代理配置去除前缀
查看>>
nginx 后端获取真实ip
查看>>
Nginx 多端口配置和访问异常问题的排查与优化
查看>>
Nginx 如何代理转发传递真实 ip 地址?
查看>>
Nginx 学习总结(16)—— 动静分离、压缩、缓存、黑白名单、性能等内容温习
查看>>
Nginx 学习总结(17)—— 8 个免费开源 Nginx 管理系统,轻松管理 Nginx 站点配置
查看>>
Nginx 学习(一):Nginx 下载和启动
查看>>
nginx 常用指令配置总结
查看>>
Nginx 常用配置清单
查看>>
nginx 常用配置记录
查看>>
nginx 开启ssl模块 [emerg] the “ssl“ parameter requires ngx_http_ssl_module in /usr/local/nginx
查看>>
Nginx 我们必须知道的那些事
查看>>
Nginx 源码完全注释(11)ngx_spinlock
查看>>
Nginx 的 proxy_pass 使用简介
查看>>
Nginx 的 SSL 模块安装
查看>>
Nginx 的优化思路,并解析网站防盗链
查看>>

